Compound Interest Rate and Dividend Growth Compounding Work in Your Favor
Compound interest is the eighth wonder of the world. He who understands it, earns it ... he who doesn't ... pays it.
Albert Einstein, German-born physicist, invented the formula that has been dubbed "the world's most famous equation": E = m*c^2, received Nobel Prize in Physics in 1921
The compound interest is very important for long-term investing. Basically, the compound interest rate is the interest on the interest. Once you have put your money to work, you reinvest your gains rather than paying them out and thereby achieve more profits.
To clarify what compound interest is, there is an interesting story that is being told: In the 3rd century an Indian invented the chess game. The king was impressed and asked him what he would like as a payment for his idea.
The inventor answered that he wanted one rice corn on the first field of the chess game and double it for every field. The king though what a modest man the investor was. What he did not realize is that for 64 fields a total of 18.4 quintillion (10^18) rice corns must be paid. More than there were existing in the world at that time.
There are two major figures to consider when you calculate the compound interest:
- The compounding frequency is the number of times per year the accumulated interest is paid out. For a monthly payout the compounding frequency is 12, for a biannual payout it is 2.
- The nominal interest rate describes the interest rate that is paid out after compounding.
To compare loans with different compounding frequencies and nominal interest rates annually the annual compound interest rate is being used. This number is also referred to as an annual percentage rate, annual equivalent rate, effective interest rate, effective annual rate or annual percentage yield. This figure is the total accumulated interest that is being paid after one year, divided by the initial sum.
If you have two investments with the same annual compound interest rate, it is better to take the one with the higher compounding frequency as you can reinvest your interests earned earlier. Even a lower annual compound interest rate might make sense in some cases so that you can reinvest your money again at an earlier point in time.
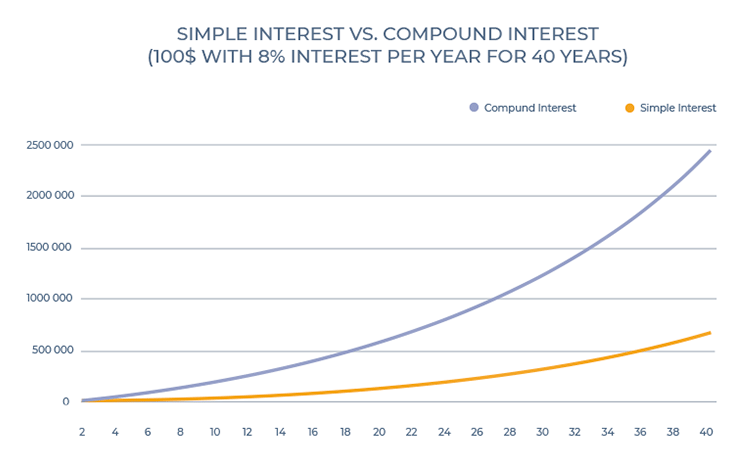
This is being shown in the following example, showing 8% annual interest on an initial $100 investment at different compounding frequencies:
There are many compound interest calculators out there that support you in choosing the best investment for you.
The rule of 12 is a simple tool to quickly calculate when your investment has doubled through the compound interest rate. Just divide 72 by the annual return and you have a good approximation. An investment of a 6% annual return will double in 12 years through the compound interest rate.
Just a short double-check, at the same time you will have about 28% less return on your initial investment if you did not reinvest your interests earned! For a $100,000 investment this means $200,000 with compound interest and $172,000 with a regular interest rate after 12 years!
Just a short hint on how to calculate this:
- (1+0,06)^12=2 times initial investment with compound growth rate after 12 years
- 12*1,06=1,72 times initial investment without compound investing
You must also take into consideration that the compound interest rate also works against you! When you have debt and pay interest rates, you are the one who has to pay this additionally.
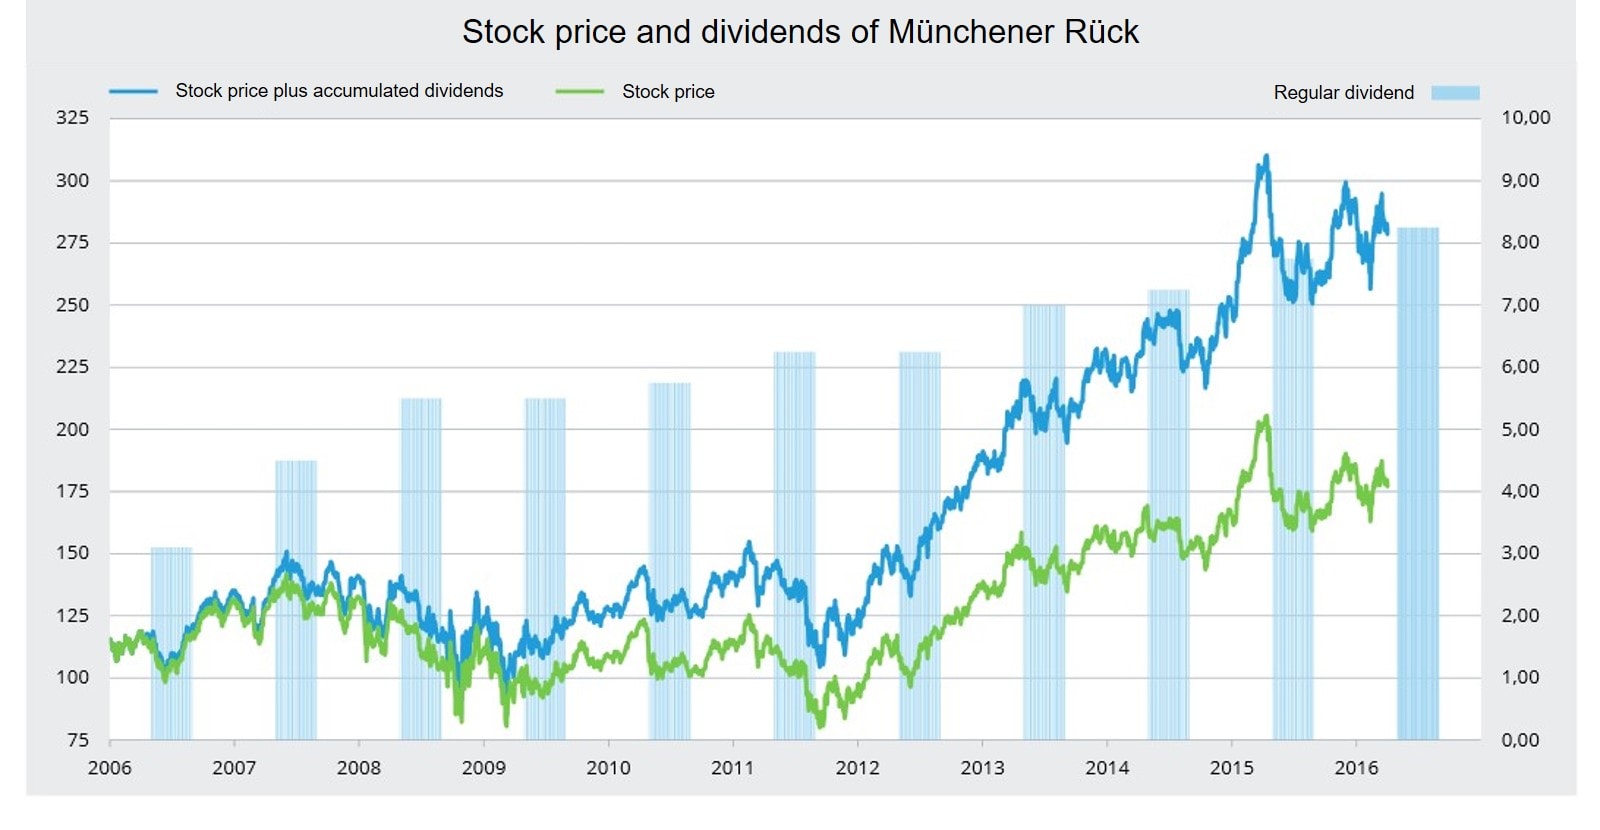
The compound interest rate works the same for stocks. When you invest in stocks, they will pay annual dividends. These dividends can be reinvested and increase your portfolio again. This is called dividend growth compounding.
The following graph shows how reinvested dividends actually reflect in relation to the value of your portfolio on an example of an insurance company.
A Market Downturn Should Not Bother You
The stock market goes up or down, and you can't adjust your portfolio based on the whims of the market, so you have to have a strategy in a position and stay true to that strategy and not pay attention to noise that could surround any particular investment
John Paulson, American investor, founder of Paulson & Co., has been called "one of the most prominent names in high finance" and "a man who made one of the biggest fortunes in Wall Street history".
Let’s put it as Warren Buffet did: “Risk comes from not knowing what you are doing.” So, to reduce your risk you have to know what you are doing. For specific investments, e.g. in companies through stocks, you must have as much information as possible.
However, this is usually difficult for the individual investor due to time limitations and also due to the limited accessibility of data. If you do not have all the data, diversification helps you to reduce your risk.
The risk controls the market. When more risky investments like stocks do not give more returns than less risky investments like bonds, people will move into the less risky investments the risky investments cheaper and increases the returns on them, which makes people move back into more risky investments. This mechanism is valid all the time.
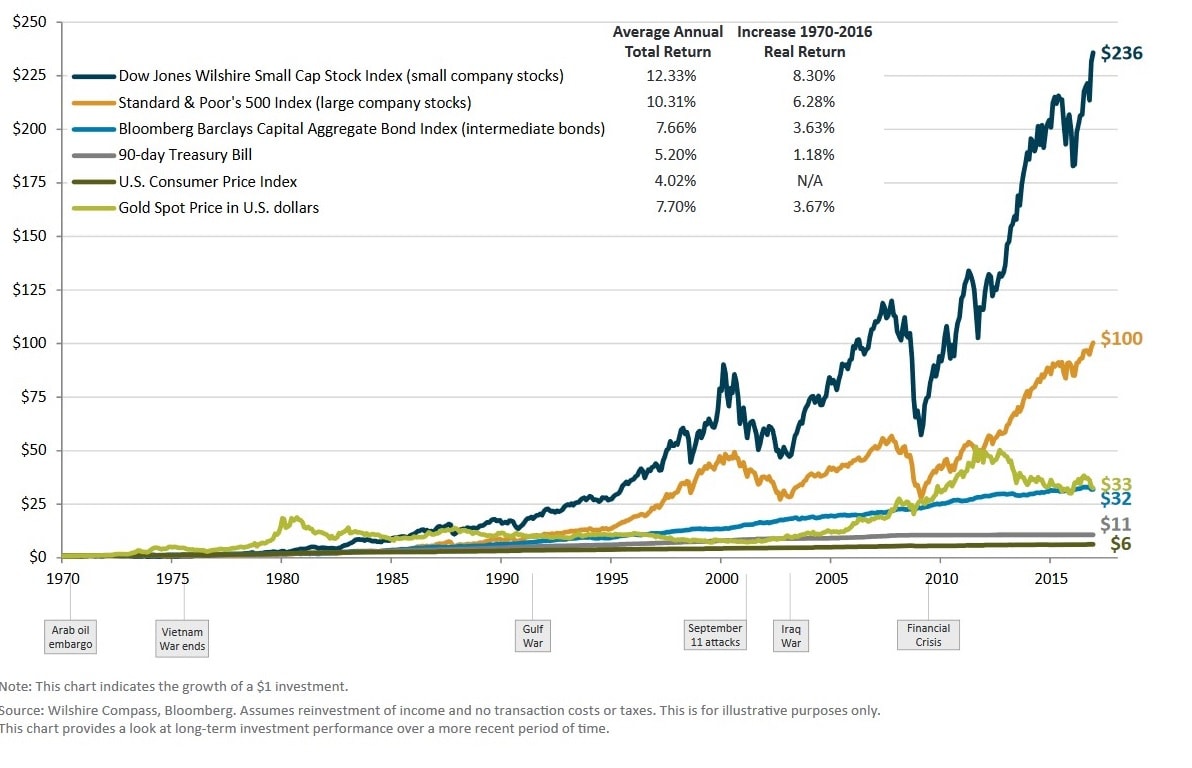
In the long-term more risky investments have paid out more and through diversification, risks can be reduced. Gold is a bad investment over time as it does not create any dividends and you cannot account for dividend growth compounding plus you have to pay storage costs.
The longer the time horizon, the more good and bad phases balance out and come to an average. However, most investors are short-time oriented and overrate the risk accordingly. This can be seen in the following graph from Advantus Capital.
Many, as much as I believe there is no way to predict a downturn in the market. So, when there is a correction, you lose money, right? And when you lose the money you should be concerned, right? Absolutely no!
A correction is typically defined as a drop of at 10% or more in the stock market and it is a common event in most market cycles as you can see in the following graph which shows the S&P 500 Drawdowns from 1945 to February 2018.
S&P 500 Drawdown and Market Cycles since 1945| Drawdown | Frequency | Average Time to Recovery |
|---|
| -5% to -10% | 39 times | 3 months |
| -10% to -20% | 13 times | 8 months |
| -20% to -30% | 5 times | 27 months |
| -30% to -60% | 5 times | 62 months |
As mentioned earlier, you are well aware that market downturns come and go and with the right strategy in place, this is the opportunity for you to buy even more stocks than before. 27% of the time the S&P 500 is negative. However, most downturns last under a year which means that the value of your investments is increasing most of the time.
What Is the Right Timing for Investing?
Far more money has been lost by investors preparing for corrections, or trying to anticipate corrections than has been lost in corrections themselves.
Peter Lynch, an American investor, averaged 29.2% annual return, created the best performing mutual fund in the world
The first important question to answer here is what is being invested. In general, you can differentiate between:
- Regular money, usually a part of your salary, that you invest.
- a certain amount of money that you can invest, e.g. money that is in your savings account or that you inherited.
Consider Continuous (Automatic) Investing Instead of Market Timing
When we talk about regular money we differentiate between continuous (automatic) investing and market timing. The most important part for many individual investors and especially young people is to put regularly a share of their salary to work. This is best done with continuous investing, meaning every month or quarter investing the respective amount. This helps you to buy more shares when the market price is low and fewer shares when the market price is up.
Following the market crash in 2009, investors who kept on following the strategy and did not get irritated could buy stocks at cheap prices, making up for the losses incurred rapidly after the market crash. The important part is to stick to the strategy when markets are down. This is opposite to market timing, where you wait for what you believe is a good point of time to put your savings into the market. However, this highly relies on your feelings and you can be wrong and do not suggest it to anyone who is not an expert in the market.
It is very difficult to make the right estimations on the future and investors working with market timing tend to underperform investors who invest regularly. Also, you must put much more effort and knowledge to execute market timing, thus there are many reasons for most individual investors to avoid market timing.
Consider Lump Sum Investing Instead of Dollar-Cost Averaging
When you invest a larger sum, e.g. all your cash savings or money that you inherited, there are different strategies. You can put all your money to work at one specific moment in time. This also goes along with choosing a good market timing and it is called lump sum investing, as you put in all the money at a specific time.
Alternatively, you can do Dollar-cost averaging (DCA). In DCA you split your investment amount into parts and invest them over time, e.g. monthly one-twelfth of the value to be invested over the course of one year. Also here, you buy more shares when prices are low and fewer shares when prices are up. The DCA postpones the investment until later dates.
Based on the historical development of balanced portfolios which increased in the long-term, many criticize the DCA and advocate for lump-sum investing. Especially in retirement investing, most individual investors never have a situation where they have a specific big amount to invest.
For further reads concerning a comparison of DCA vs. lump-sum investing, please see here:
Constant Investment Is Important
The best way in my view is to just buy a low-cost index fund and keep buying it regularly over time, because you'll be buying into a wonderful industry, which in effect is all of American industry...People ought to sit back and relax and keep accumulating over time
Warren Buffett, American investor, CEO of Berkshire Hathaway, considered one of the most successful investors in the world (CNBC MarketWatch 5/7/2007)
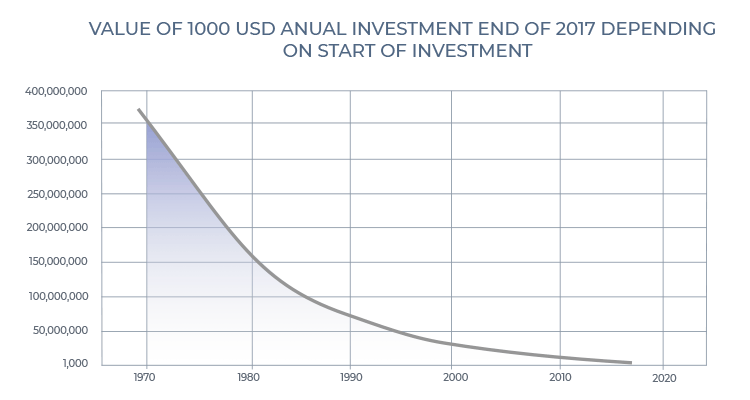
So how do we know that it actually does not matter when we invest? Let’s have a look at some historic data. To make it as independent and reliable as possible we look at the MSCI World for Large and Mid Caps.
Let’s assume we want to invest the same amount of money every year, just as we said earlier. Let’s start with 1000 USD every year. When we look at the data we see that 1969 already started with a negative -5,71% growth. So at the end of the year, we have lost some money.
However, we already start with more money in 1970 than the person who only invests 1000 USD in 1970. This difference of 942,92 USD (1000 USD-5,71%*1000) gives us an edge of more than 20,000 USD at the end of 2017. Important to understand here is that the graph is smooth and clear.
There is no other option than to start investing regularly as early as possible and not to pull out at bad market conditions. We will explain this later in this chapter as not to become a procyclical loser.
Based on our previous example we also have to understand that things are different when you are planning to invest a large lump sum. If you are not absolutely sure that the market is low and you want to invest all your money at once you better go with a dollar-cost averaging.
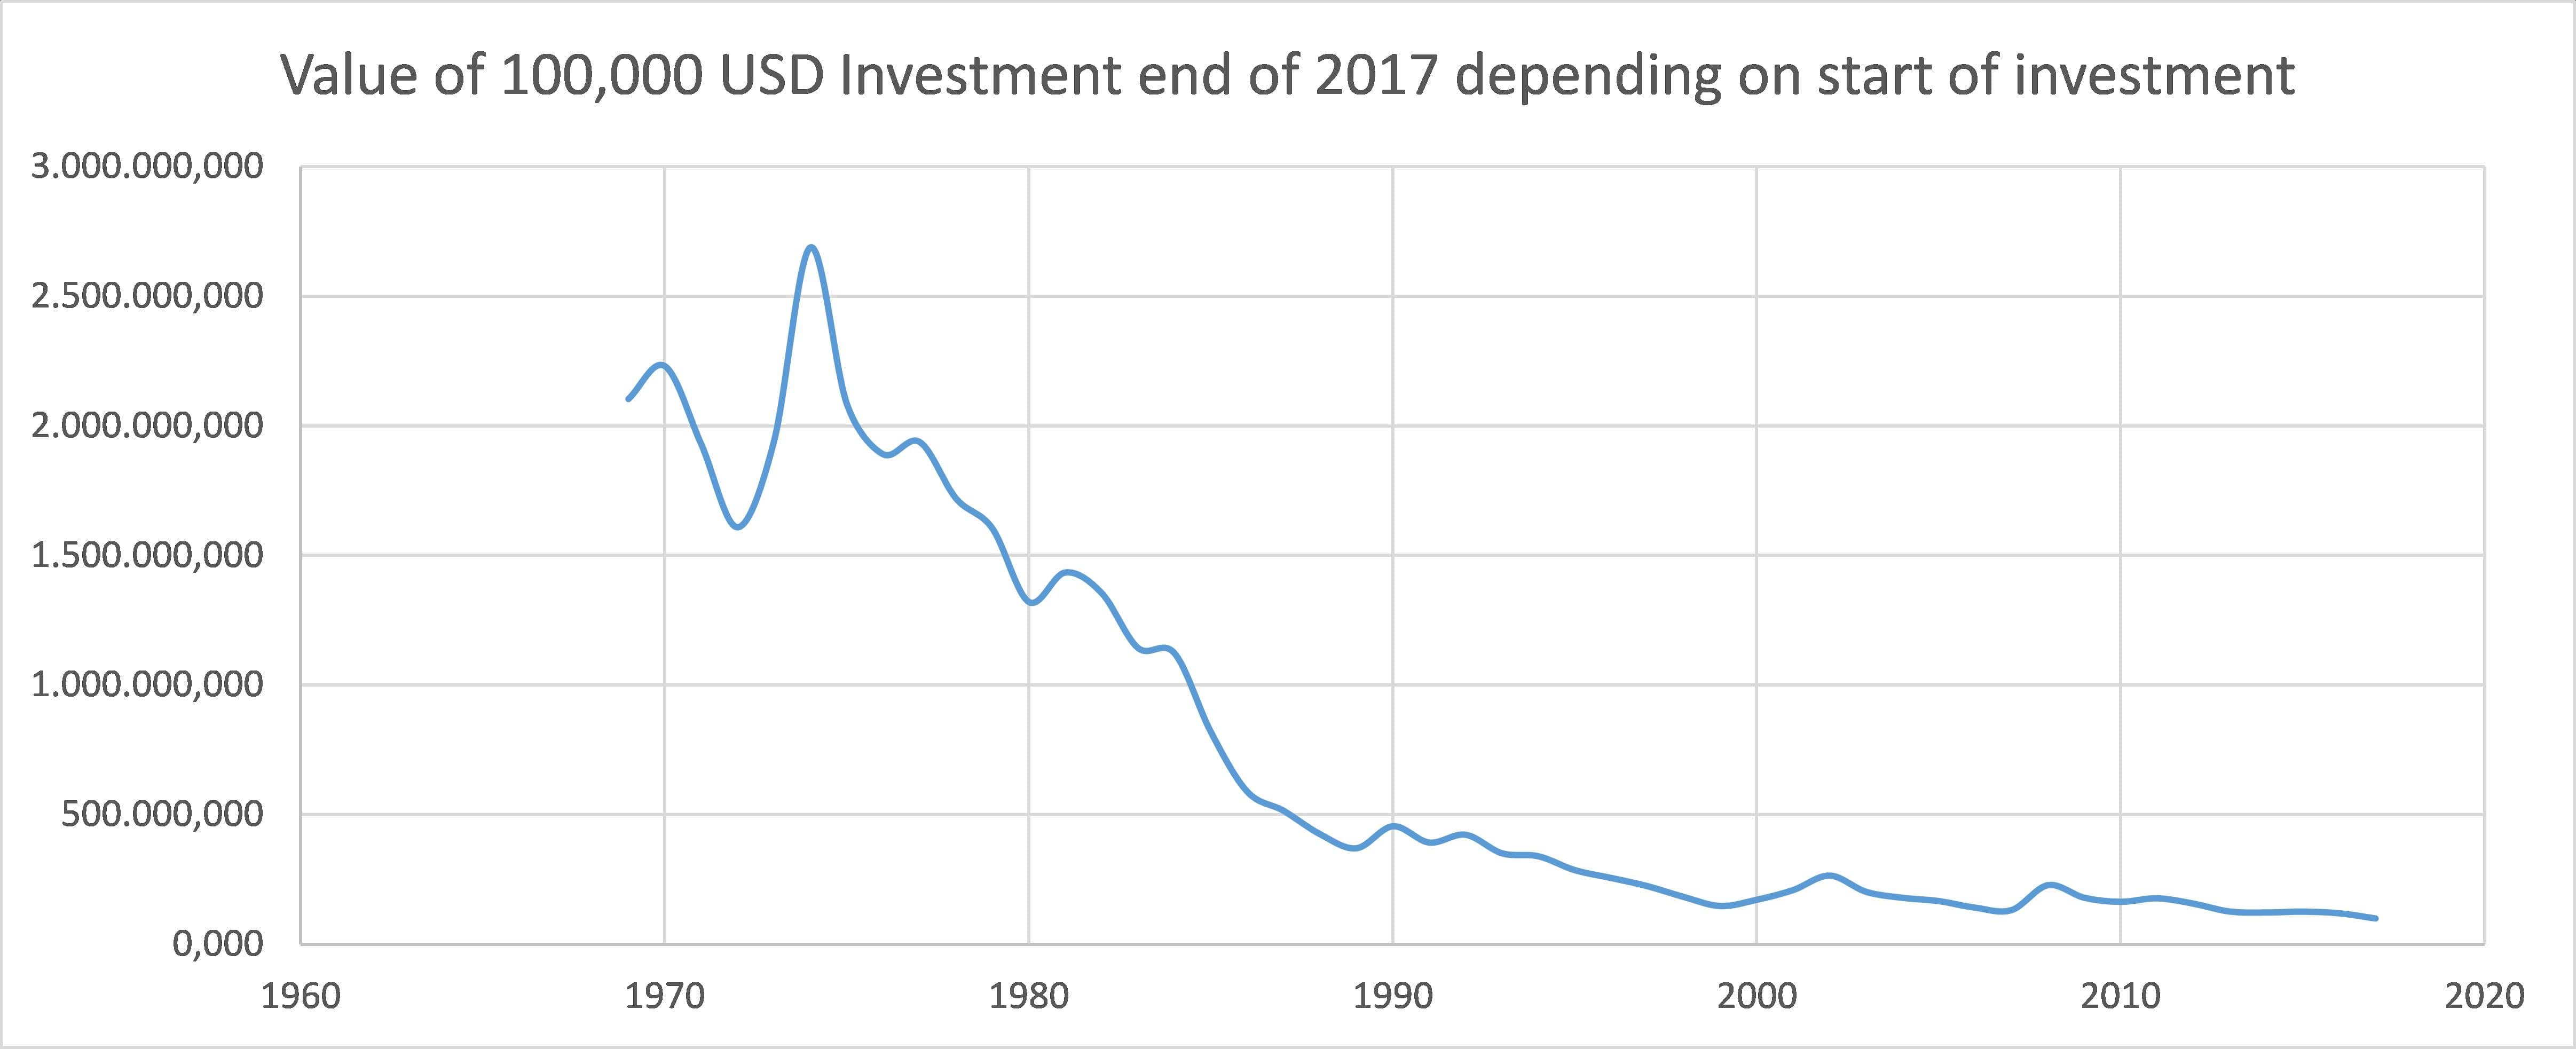
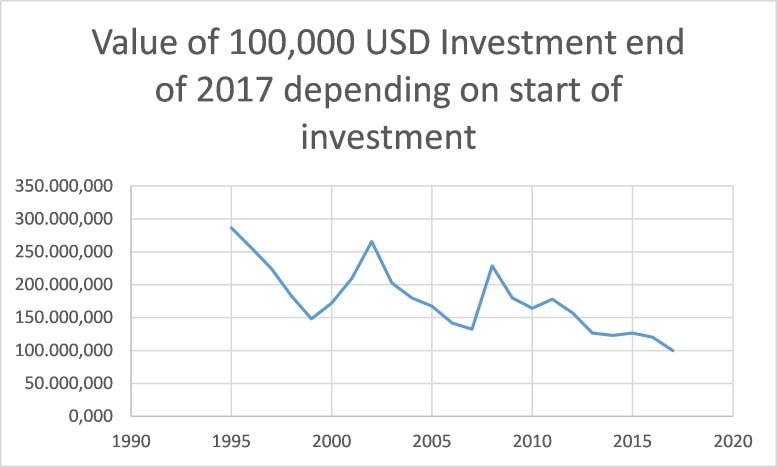
Let’s look at an example of putting a lump sum of 100,000 USD in the market. As we can see in general you can say that you will make money, how much depends on the recent market conditions of the current economic cycle you are in.
It gets even more obvious when you look at more recent data. When you invested 100,000 USD at the end of 2000 you end up with 172,237 USD in 2017, when you waited to invest the same amount in 2002 you ended up with 265,608 USD.
If you waited too long, and invested in 2005 you ended up with 167,235 or even worse with 132,392 when you waited until the end of 2007.
So as we can see it is really difficult to time the market. Investing in 2000 and taking the two crises of 2000 and 2008 is still better than missing out on the growth years and investing before the crisis of 2008 and only taking one crisis.
All this data is using the growth rates concerning the MSCI World. Dividends (Gross and Net) are not included in the calculation. Anyone interested can download all historic data at MSCI.
Money Has to Go Somewhere
Investing is simple. It’s the financial industry that works hard to make it complex!
Robert Rolih, public speaker and author of “The Million Dollar Decision”
You will see later that there are different Asset Classes and Instruments that you can use to invest. However, stocks are an important part of an investment strategy. As they allow us to understand basic principles better we use them in the following to explain our ideas. Though, stocks are only one possibility to invest.
In the academy, we will give you an overview of the most important possibilities to invest. Just for this chapter, we will stick with examples of stocks mostly. A lot of money is invested through funds where the money is spread across different stocks, bonds or other assets to reduce the risk.
In the last decades, investments in funds and other products that follow the indexes have increased rapidly, in 2014 there were 74 million USD invested in these instruments. Nowadays, private investors have more money invested in these instruments than in stocks or bonds directly. This leads to a changing environment on the market:
- Fund managers cannot manage their portfolios as they wish anymore. When public opinion reaches a point where most investors want to sell, the fund managers have to sell their stocks to pay the investors.
- Private investors give fund managers a lot of money when markets are high and take out their money when markets go down. This leaves them also with the fact that they have no more money to invest, even though especially at this low point they should invest.
- Market trends are intensifying themselves as stocks which were previously unrelated and might have shown opposite directions now are depending on each other as they are connected through funds.
This leaves you with two main strategic pillars:
- When you invest in funds, look at the long-term perspective and keep them when everybody sells.
- When you have direct investments into specific companies through stocks, look at what insiders from that company are doing.
The Development of the Markets
The over-all point is that new technology will not necessarily replace old technology, but it will date it. By definition. Eventually, it will replace it. But it's like people who had black-and-white TVs when color came out. They eventually decided whether or not the new technology was worth the investment.
Steve Jobs, American business magnate and investor, founder of Apple Inc., Pixar and NeXT
For the development of markets, there are two main drivers:
- Population in the world
- Technological progress
The Population Is Growing
The global population is increasing as well as the average wealth, and this means that there will be a constant growth in the long term. Projections of the United Nations say that the global population will be 9.8 billion in 2050, and 11.2 billion in 2100, meaning a lot of growth potential for the world.
The Technology Is Moving Ahead
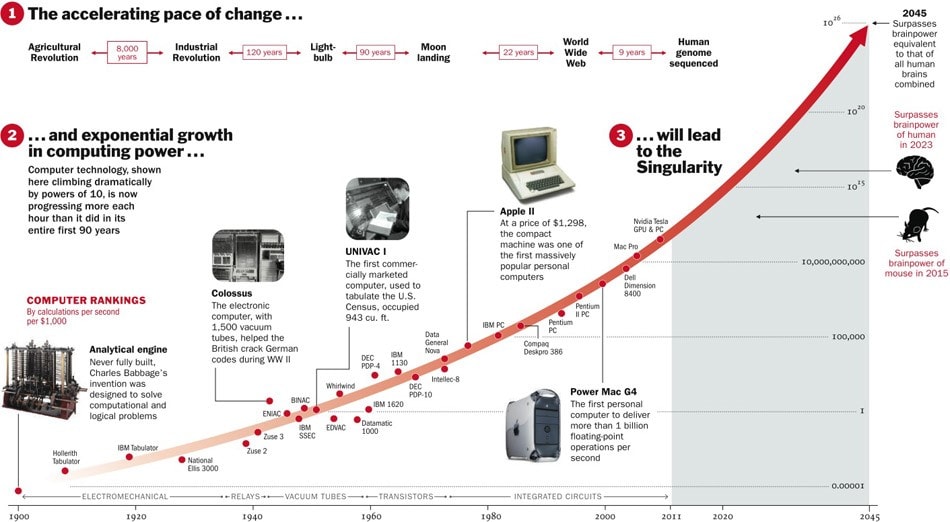
Furthermore, technological development is expanding faster than ever. Moore's law describes the exponential development of the computing power and the law is still valid with technological development moving ahead.
The next generation of self-driving vehicles and artificial intelligence is coming with a lot of space for growth. According to The Time artificial intelligence will reach human intelligence by 2023 and the intelligence of all people in the world by 2045.
Summary
The compound interest rate, especially together with dividends (dividend growth compounding), is the main driver for the successful development of your investment.
You should invest constantly and not listen to major market moves, you will buy more when stocks are cheap and buy less when they are expensive. When you try to time the market you will lose money as you will be waiting with no returns for a long time.
Technology and population are moving ahead, real growth is there. Invest and keep your strategy! Take the quiz below and continue reading our next article.