The Theory Behind the CAPE
The Cyclically adjusted price-to-earnings ratio is calculated as the price of an index divided by the average of ten years of earnings (moving average). The earnings are adjusted for inflation. This means simple the earnings of all S&P 500 companies of the last ten years are adjusted to the dollar's value today, then the average is being calculated. Then the current value of the S&P 500 is divided by the average.
Using the average over ten years instead of the current P/E ratio elimination fluctuation because of recent business cycles.
The History Behind the CAPE
In 1934 Benjamin Graham and David Dodd recommended in their book "security analysis" that one should use an average of earnings over preferably seven or ten years to evaluate the market conditions.
In 1996, Robert Shiller and John Campbell went on with this thought. They presented their initial research concerning the relationship between the Cyclically Adjusted Price-Earnings and the outlook on the economy to the Board of Governors of the Federal Reserve.
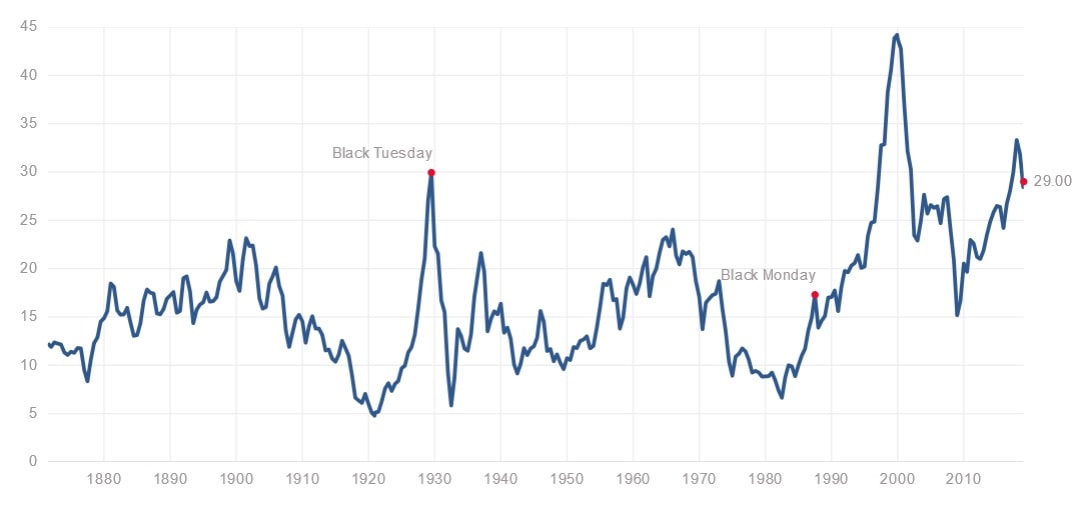
In 2008 they published the more detailed paper "Valuation Ratios and the Long-Run Stock Market Outlook" to prove their theory. Their paper smoothed earnings for the S&P 500 by calculating an average of real earnings over the past ten years, going back to 1872.
As the predictions in the paper, based on the past value, turned out to be quite accurate, the CAPE has become a well-established indicator to assess the market valuation. However, there are critics, which we will explain at the end of the chapter.
How to Interpret the CAPE
The evaluation of the CAPE needs the indicator itself and the historical average. The market is considered overpriced when the PE ratio is above its historical average. The degree of how much overpriced is to be seen in relation to the historical average. The average in recent years has been between 15 and 17; the CAPE reached its peak at 44.19 in 1999.
Please see the links below for the current CAPE and the historical average.
The CAPE can also be used to go into detail and analyze specific market segments, as demonstrated here.
Flaws of the Shiller CAPE
Several people critic the CAPE, and a general critic is that it is somewhat backward-looking than forward. For example, Jack Boroudjian, chief investment officer at Index Financial Partners, criticizes the Shiller CAPE in a CNBC interview.
Also, accounting rules might have changed over time. Jeremy Siegel published a paper in 2016 in which he says that the CAPE is too pessimistic as the accounting rules have changed.