The Theory Behind Market Sentiments Indicators
The market and the buyers in the market have a certain perception concerning the risk being in the market at the moment. The market prices are depending on people buying.
When everybody in the market is nervous, minor events can cause people to sell. Therefore, market sentiments indicate how nervous people in the market are.
There are difference approaches to measure market sentiments:
- Technical indicators, such as trading volume, volatility, such as the Chicago Board Options Exchange (CBOE) Volatility Index (VIX), the New York Stock Exchange (NYSE) High/Low Indicator or the NYSE 200-day Moving Average.
- Survey-based sentiments, such as the University of Michigan Consumer Sentiment Index or the U.S. consumer confidence index (CCI).
- Text mining, where the positive and negative terms on the internet concerning certain stocks and the general economy are evaluated, e.g. from Twitter. There is some research out there, which is quiet specific.
- Internet Search behavior evaluates data from search engines such like Google or Yahoo to find trends and predict market sentiments.
How to Use Market Sentiments Indicators
There are many different sentiment indicators. The important thing to understand is that sentiment indicators:
- Are not Precise signals to buy or sell;
- can be an early warning system but are wrong often, too;
- can only be analyzed in context with other indicators.
In the following, we will present some easy to understand indicators which aggregate information and make it easily accessible.
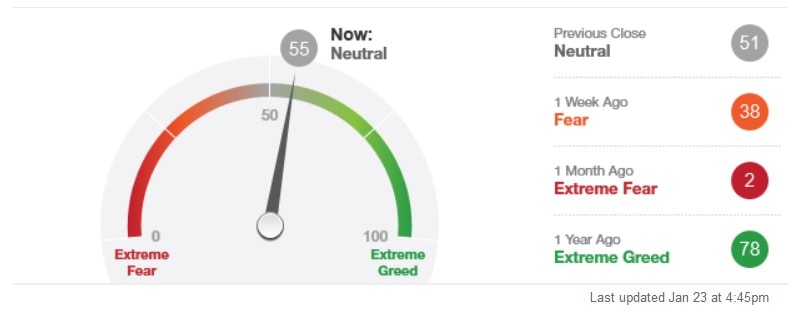
The CNN Fear and Greed indicator builds on technical indicators:
- Market Volatility
- Junk Bond Demand
- Put and Call Options
- Safe Haven Demand
- Stock Price Strength
- Stock Price Breadth
- Market Momentum
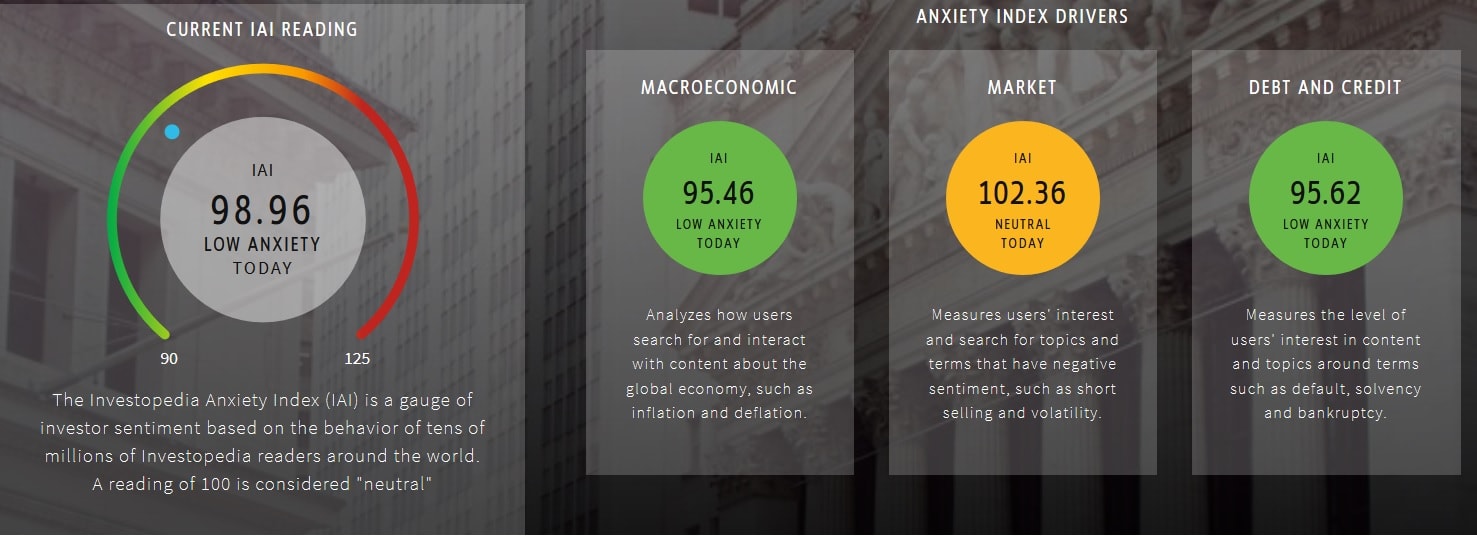
The Investopedia Anxiety Index builds on searches on the Investopedia homepage:
- Macroeconomic (searches of users concerning inflation and deflation)
- Market (user’s interest with negative sentiment, e.g. short selling and volatility)
- Debt and credit (user’s interest concerning terms default, solvency and bankruptcy)

