The Theory Behind the P/E Ratio
In this explanation, we focus on the meaning concerning a market. We do not go into the detailed analysis of single stocks. The P/E ratio can be calculated on reported earnings (after-tax net income) of the past 12 months (real) or on estimated earnings for the next 12 months (prediction). Some analysts may also use the operating earnings (Earnings before interest and taxes – EBIT). The most frequently used figure is based on reported earnings, which we will consider in the following.
P/E Ratio (Based on Annual Report)
The P/E ratio is calculated based on the earnings of the annual report. This takes into account the respective fiscal year of the company. In contrast to the calendar year which goes from January to December, a company reports their numbers according to their fiscal year, which can be June from one year to May of next year, for example. The earnings of the most recent fiscal year can be found in income statement in the annual report.
Meanwhile stock prices are moving, earnings stay the same throughout the year. Therefore, we are not looking into this indicator in detail, we look at the trailing and estimated next 12 months P/E ratios to get a more up-to-date picture. However, the data remains not up-to-date.
Trailing 12-Months P/E Ratio (Based on Quarterly Reports)
The trailing 12-months P/E ratio is calculated based on the earnings of the past 12 months. The data is being taken from the quarterly reports. The trailing P/E is used to evaluate if the market is priced correctly, as it gives a relative figure.
The disadvantage is that earnings are only reported every quarter meanwhile the prices move constantly. However, the trailing P/E ratio is already much more up-to-date than the regular P/E ratio which is based on annual reports.
Forward P/E Ratio (Estimated Next-12-Month Earnings)
As the regular P/E ratio is only looking backwards, another P/E ratio was introduced. The Forward P/E ratio calculates the ratio between the current price and the projected earnings. Usually companies report the projected earnings in their quarterly and annual reports for the end of the fiscal year or even for the end of the next fiscal year. However, the estimates are not necessarily reliable and can differ hugely by industry.
A conservative industry in the food sector may well project their increased sales due to new countries they offer their products in. However, a software or internet company may not be able to projects their numbers accurately. A study by Cliff Asness and Anne Casscells showed that the forward P/E was on average 24% lower than the reported P/E. This should be taken into account when evaluating the forward P/E.
How to Interpret the P/E Ratio?
The P/E ratio in whatever form you use it does generally not allow to give any evaluation concerning the market in terms of an upcoming crisis. The weak point of the P/E ratio is that it always works with out-of-date data. Also, it does not necessarily tell you if a market is valued correctly.
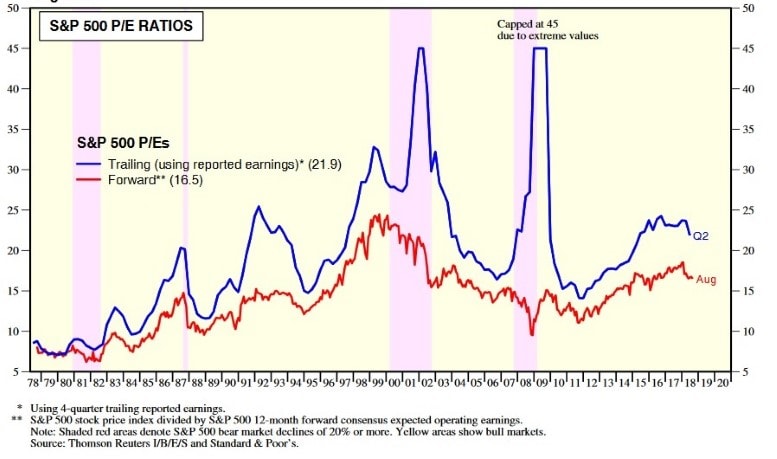
During the financial crisis earnings collapsed and the S&P 500 P/E ratio skyrocketed, which was a point to buy stocks as prices were low. However, earnings were even lower and the P/E ratio rose very high. This means the P/E ratio only works in a relatively normal environment, but it is not an indicator for an upcoming crisis and not the one-and-only indicator to assess the market. As the P/E ratio is not a reliable indicator to predict a crisis, the CAPE indicator was developed, which is explained in an own article.
The following picture shows an analysis of the past and the respective values of the trailing and forward P/E ratio.
Up-to-date data can be found here: