The Theory Behind the Price to Sales Ratio
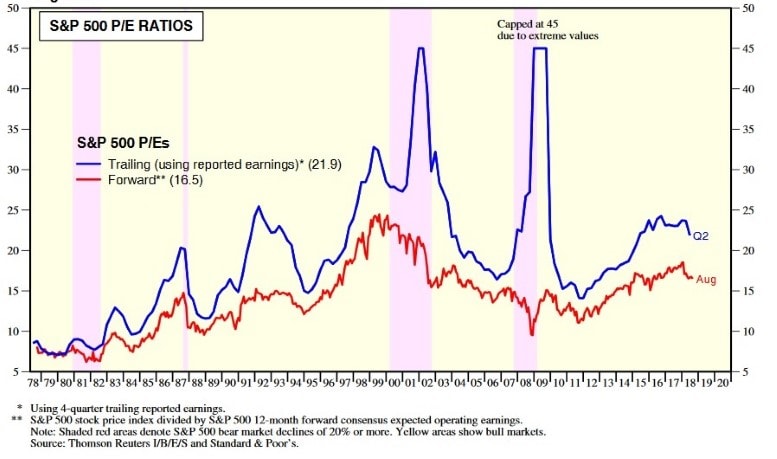
Price-Earnings-Ratios are a common indicator for stocks and markets. However, they can be poor valuation indicators in periods where profits decrease.
For example in 1991, the P/E ratio reached 20 because profits sunk. However, stocks were entering a new bull market. In October 2002, at the low dot-com bubble, PE ratios were above 30, anyways it was the moment to buy as the bear market reached its bottom.
This is what we already saw in our previous article about the P/E ratio.
Also, the P/E ratio can be influenced by companies cutting costs and going for short term profitability and returns, especially through increased margins.
Therefore, the Price-to-Sales ratio is an indicator that can give additional information when the P/E is not working.
How to Use the Price to Sales Ratio?
Just as P/E ratios, P/S ratios had different values at peaks and bottoms of the market. Looking at the table below, you can see the major peaks and bottoms of the S&P500 since 1955.
As we can see, there is no clear pattern of a fixed number that indicates a high or a low. Rather the context has to be seen. Markets in 1981 peaked at a P/S ratio 0.52 and they bottomed at 0.54 in 1973. On the other hand, markets peaked at 1.37 in 1961 and bottomed at 1.31 in 2003.
Price to Sales Peaks and Troughs for S&P 500| Date Peak | P/S Peak | Date Trough | P/S Trough |
|---|
| Apr 6, 1956 | 1.02 | Oct 25, 1960 | 0.89 |
| Jan 8, 1960 | 1.18 | Oct 28, 1960 | 1.06 |
| Dec 15, 1961 | 1.37 | Jun 29, 1962 | 1.02 |
| Feb 11, 1966 | 1.32 | Oct 7, 1966 | 1.00 |
| Dec 6, 1968 | 1.27 | May 29, 1970 | 0.83 |
| Apr 30, 1971 | 1.10 | Nov 26, 1971 | 0.96 |
| Jan 1, 1973 | 1.11 | Dec 6,1974 | 0.54 |
| Sep 24, 1976 | 0.67 | Mar 3, 1978 | 0.49 |
| Sep 8, 1978 | 0.60 | Apr 25, 1980 | 0.49 |
| May 1, 1981 | 0.52 | Aug 13, 1982 | 0.40 |
| Dec 2, 1983 | 0.62 | Jul 27, 1984 | 0.56 |
| Aug 28, 1987 | 0.99 | Oct 23 1987 | 0.74 |
| Jul 20, 1990 | 0.85 | Oct 12, 1990 | 0.72 |
| Jul 17, 1998 | 2.04 | Aug 4, 1998 | 1.67 |
| Mar 24, 2000 | 2.44 | Mar 14, 2003 | 1.31 |
The level of the P/S is also depending on the general profitability of the market. If the market is highly profitable, a higher P/S ratio makes sense. This becomes especially clear, when we look at single stocks of highly profitable companies, they can be over 4 and well priced.
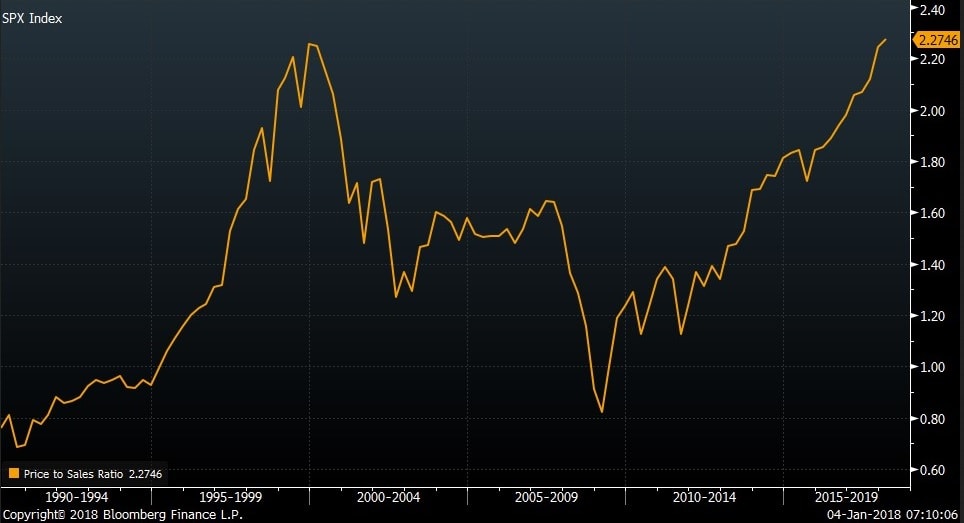
Stocks of companies with little profitability can have a P/S of as low as 0.25 which might be a correct market pricing. The following graph shows the P/S ratio of the last two crises (dot com bubble 2000-2002, housing bubble 2007-2009) where we see higher P/S ratios than in the past.
Up-to-date data for the P/S ratio of the S&P 500 can be found here