The Theory Behind Household Debt
Especially the crisis of 2007-2009 put a focus on research concerning private debt. Mian and Sufi (2010) were the first ones to investigate profoundly which was also confirmed by the Federal Reserve and the International Monetary Fund IMF recently. The following quotes show recent research results and the relation between private debt and crises.
"[…]the long-run record shows that recurrent episodes of financial instability have more often than not been the result of credit booms gone wrong, most likely due to failures in the operation and/or regulation of the financial system"
Schularick and Taylor 2012
"We find that the interaction of mortgagecredit growth and increasing house prices is a good predictor of a creditboom. Credit booms in which the share of mortgage credit in total bank credit increases more, are credit booms which are more likely to ‘go bad’,leading to subsequent credit growth contractions."
Bezemer and Zhang 2014
With the respective learnings that we are taking from the recent literature, it makes sense to keep an eye on the private debt.
How to Use Household Debt?
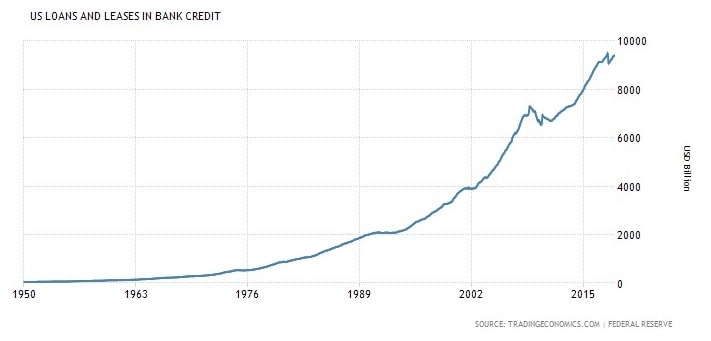
The first thing to look at is the overall debt. The respective curve of the recent years shows that the total debt is constantly increasing. However, this may also be due to inflation. Therefore, we look at relative indicators.
Some relative indicators, which we will be explaining in the following, are:
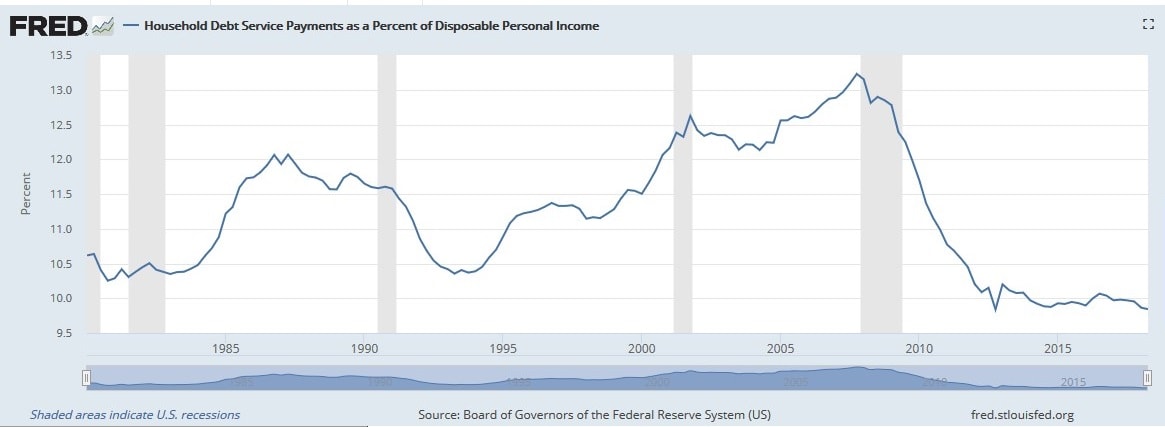
The Household Debt Service Payments as a Percent of Disposable Personal Income (TDSP) show the current monthly debt payments of US households as a share of the personal income. The FRED graphs also show the crises, marked as gray areas and the respective levels of service payments. As we can see, especially in the recent crises in the early 2000s and 2007-2009, there is a strong correlation between the percentage and the time of the crises.
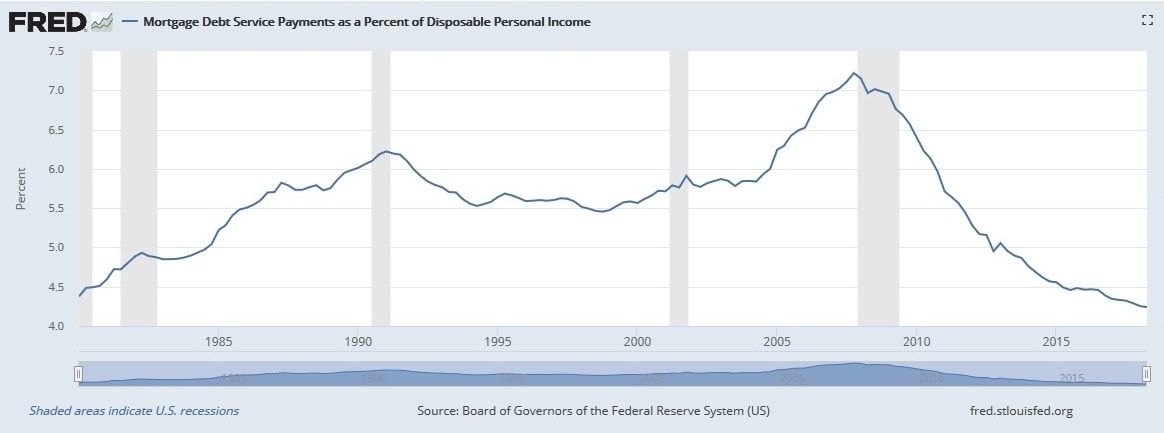
The Mortgage Debt Service Payments as a Percent of Disposable Income shows only the Mortgage share of the debt, as this has been identified as a driver for possible crises.
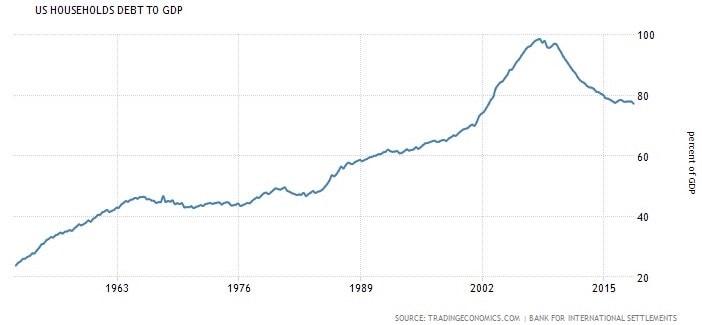
Another relevant relative indicator is the United States Households Debt To GDP.