The Theory Behind the Q-Ratio
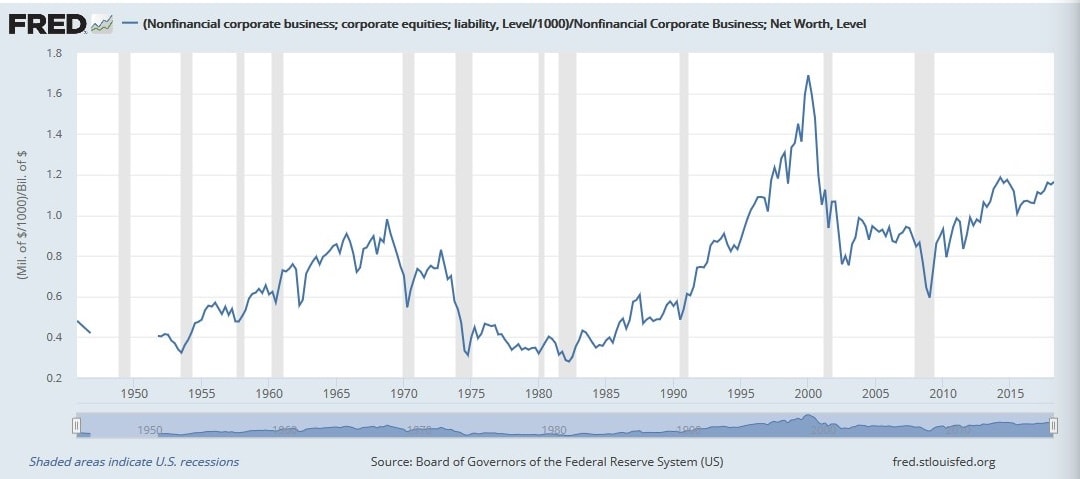
The Q-Ratio was introduced by Nobel Laureate James Tobin in 1969. The respective data can be found at the database of Federal Reserve of St. Louis (FRED). However, this is not a very timely database, data is about 2 years old when being released and 3 more months will pass until the next release. Therefore, the net worth can be adjusted by estimations based on recent market movements, e.g. based on the changes of the Vanguard Total Market ETF.
According to theory the value should be 1. However, practice has shown that the average has been roughly 0.7. The all-time-high was in the dot com bubble in the 2000s at around 1.6, the lows in 1921,1932 and 1982 around 0.3. title. The geographic mean is about 0.8.
How to Use the Q-Ratio
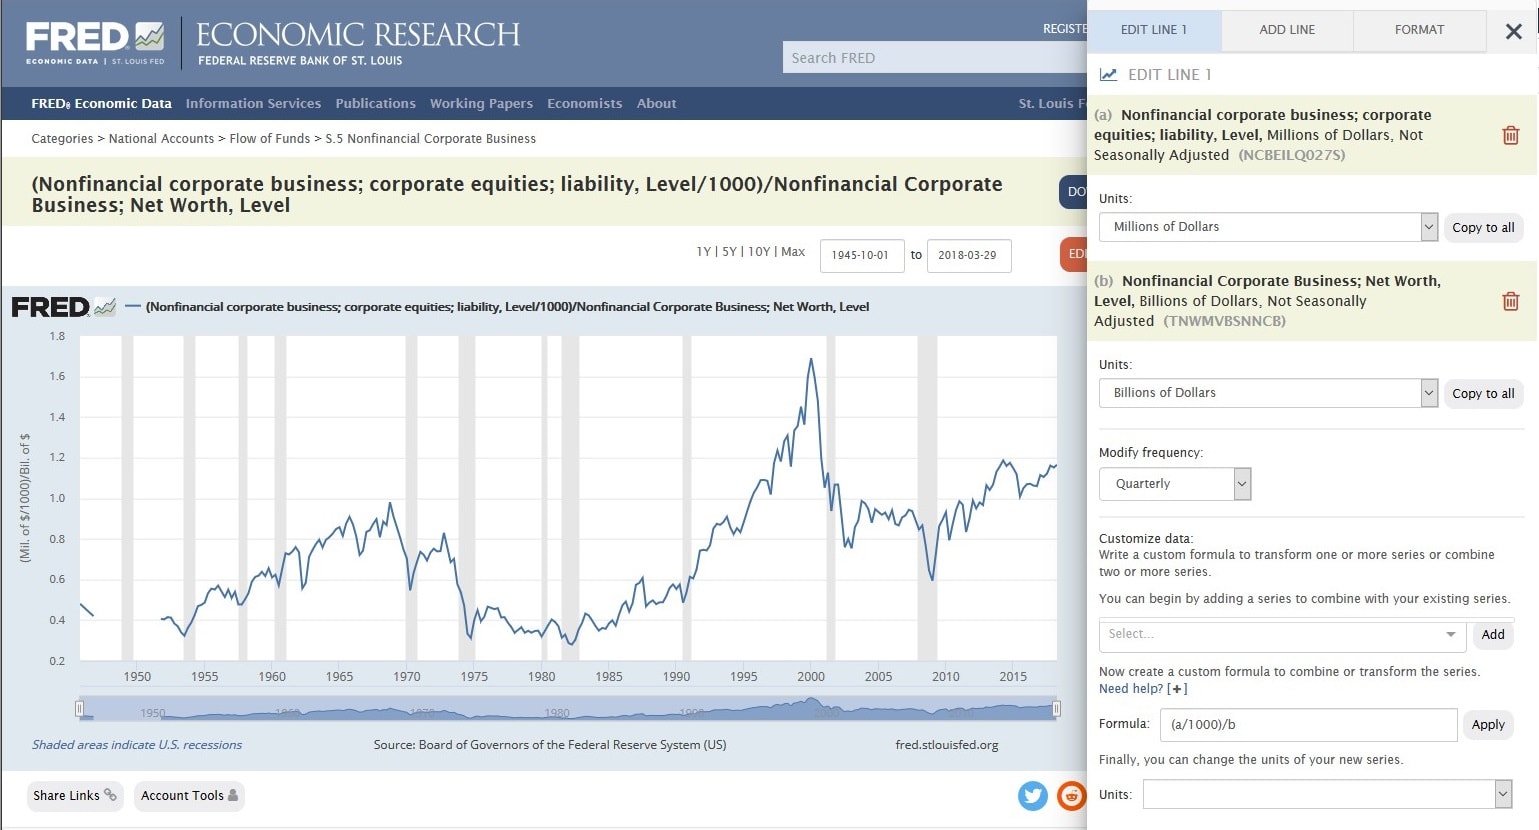
You should look at the recent years and evaluate the development of the Q-ratio accordingly. As with any other indicator the value has to be seen in the context. You can use the original data prepared by FRED.
You will have to edit the graph and calculate the respective percentage. This is quiet easy by
- Nonfinancial corporate business; corporate equities; liability, Level divided by 1000
- Divided by: Nonfinancial Corporate Business; Net Worth, Level
The tool is easy to use, just click edit graph as seen in the screenshot below.