What Is the Yield Curve?
Debt instruments like bonds pay interest rates. The interest rates usually depend on the maturity dates (assuming the same quality at the same time). The most common reference is the U.S. Treasury debt.
The Theory Behind the Inverted Yield Curve?
Usually, an investor gets a higher interest rate for a long-term bond than for a short-term bond as he dedicates his money for a longer time. The bond's interest rate on the day it is issued is based on demand, just as stocks. If there is a lot of demand for a specific bond, the interest rates will be lower. This explains how the yield curve can look different based on the demand.
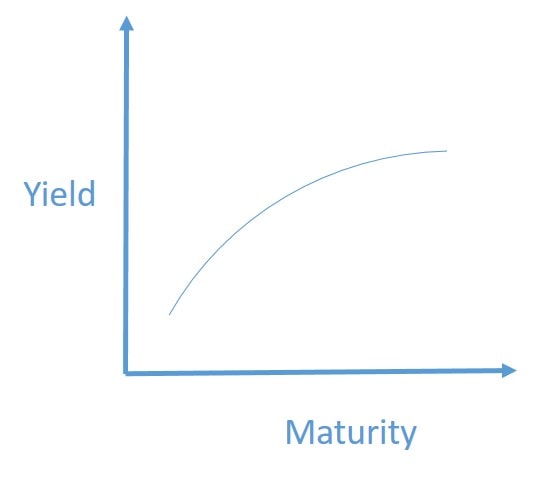
Normal Yield Curve
In a bearish market, the investors expect the long-term interest rates to increase. Therefore, the investors put the money in short-term bonds in the hope of purchasing long-term bonds with higher interest rates later on. The yield curve slope will be steep as there is a high demand for short-term bonds, which reduces the interest rate.
The normal yield curve indicates that the interest rate (or yield) on longer-term bonds is higher than the interest rate for shorter-term bonds, which can be seen in the following picture.
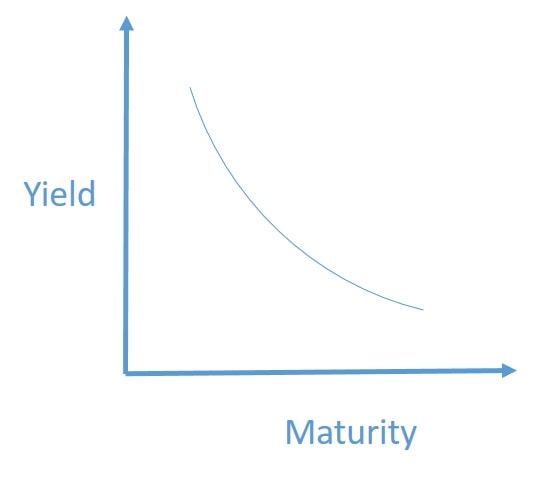
Inverted Yield Curve
An inverted yield curve means that the yield curve is the other way around compared to the normal curve. The downslope indicates that investors expect long-term yields to decrease in the future. Therefore, there is a strong demand for long-term bonds and a lack of demand for short-term bonds. This leads to higher interest rates for short-term than long-term bonds, which signifies an upcoming recession.
Flat Yield Curve
A flat yield curve can occur in the transition from a normal to an inverted yield curve and the inverted yield curve to a normal yield curve. Depending on where it is coming from, it can be a sign for a market recovery (from inverted to normal) or for a recession (from normal to inverted.
How to Interpret the Yield Curve With Data of Today
The basis for the evaluation of the yield curve is up-to-date data. The following links provide the yield curves for U.S. treasury debt and the Euro area.
However, the yield curve only shows the picture of one specific day. Getting reference points makes sense to get an overview of the history of the yield curve. Each yield curve has several different maturity dates, and it can get messy to evaluate all of them.
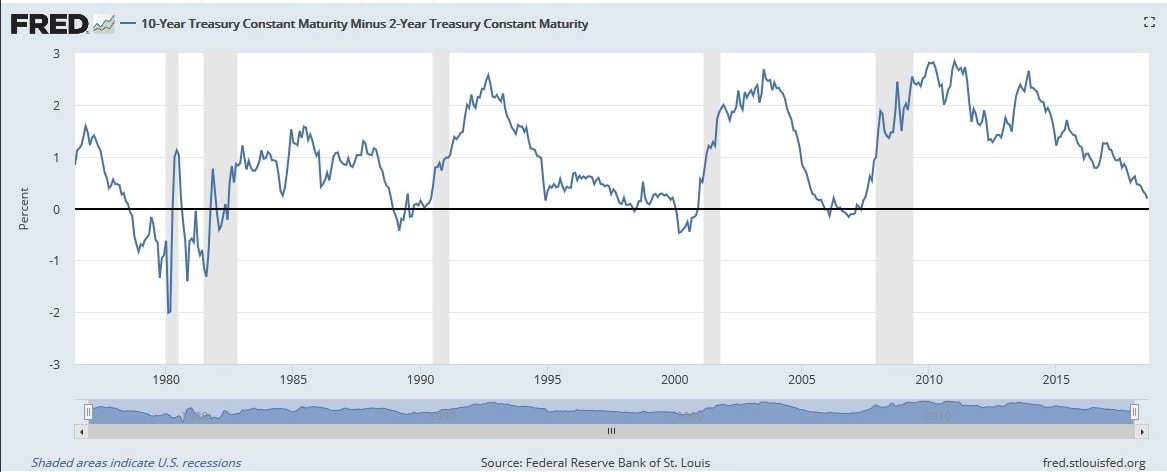
To simplify, it makes sense to look at the difference between a long-term and a short-term bond. A common and practical example is looking at ten-year and two-year interest rates. The difference between them can be drawn in a graph and show a simplified picture of the yield curve with two data points over time.
The following chart shows the 10-year treasury maturity minus two years treasury maturity over time. The lows of the graph usually happen sometime before a crisis came up, e.g., shortly before the dot-com bubble (2002-2003) and the housing bubble (2007-2008).
Also, the rising graph indicates prosper bullish markets. The graphs can be found at the Federal Reserve Bank of St. Louis.