The Theory Behind Private Household Financial Assets
Several research institutes and other financial institutions have elaborated that the share of household assets in stocks can indicate a possible crisis (Source 1, Source 2, Source 3). However, Advisor Perspectives points out several flaws in this indicator.
Empirical flaws: The indicator only worked in a couple of cases during the last century; some crashes occurred at low equity rates.
Technical flaws: When markets rise, the overall value of the household’s assets increase and along with it the share of stocks of the assets, as they are the ones mainly gaining value. The same accounts, when the markets go down, the value of the stocks will decrease and accordingly its value. Therefore, it is unclear if the indicator is trailing or giving an outlook.
After all, as with any indicator, it has to be looked at carefully in the context of other indicators.
How to Use Private Household Financial Assets
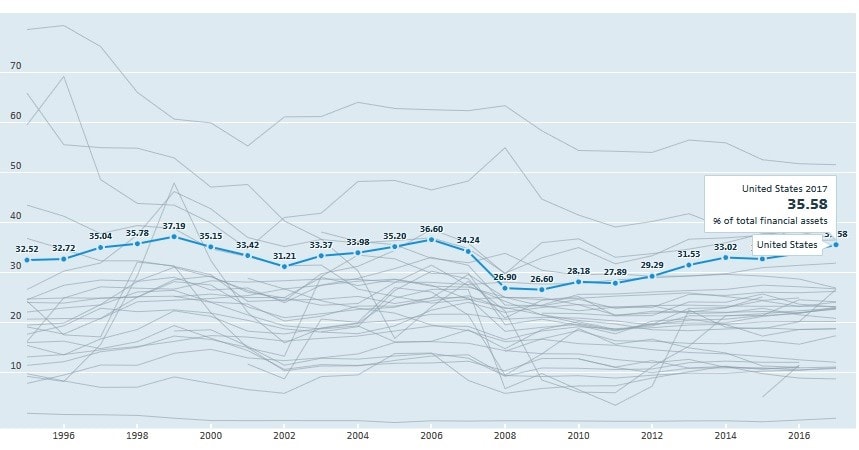
Technical data can be achieved directly from OECD, which offers a handy tool that gives you an overview of different countries and the share in the respective asset classes.
Advanced Use of Private Household Financial Assets
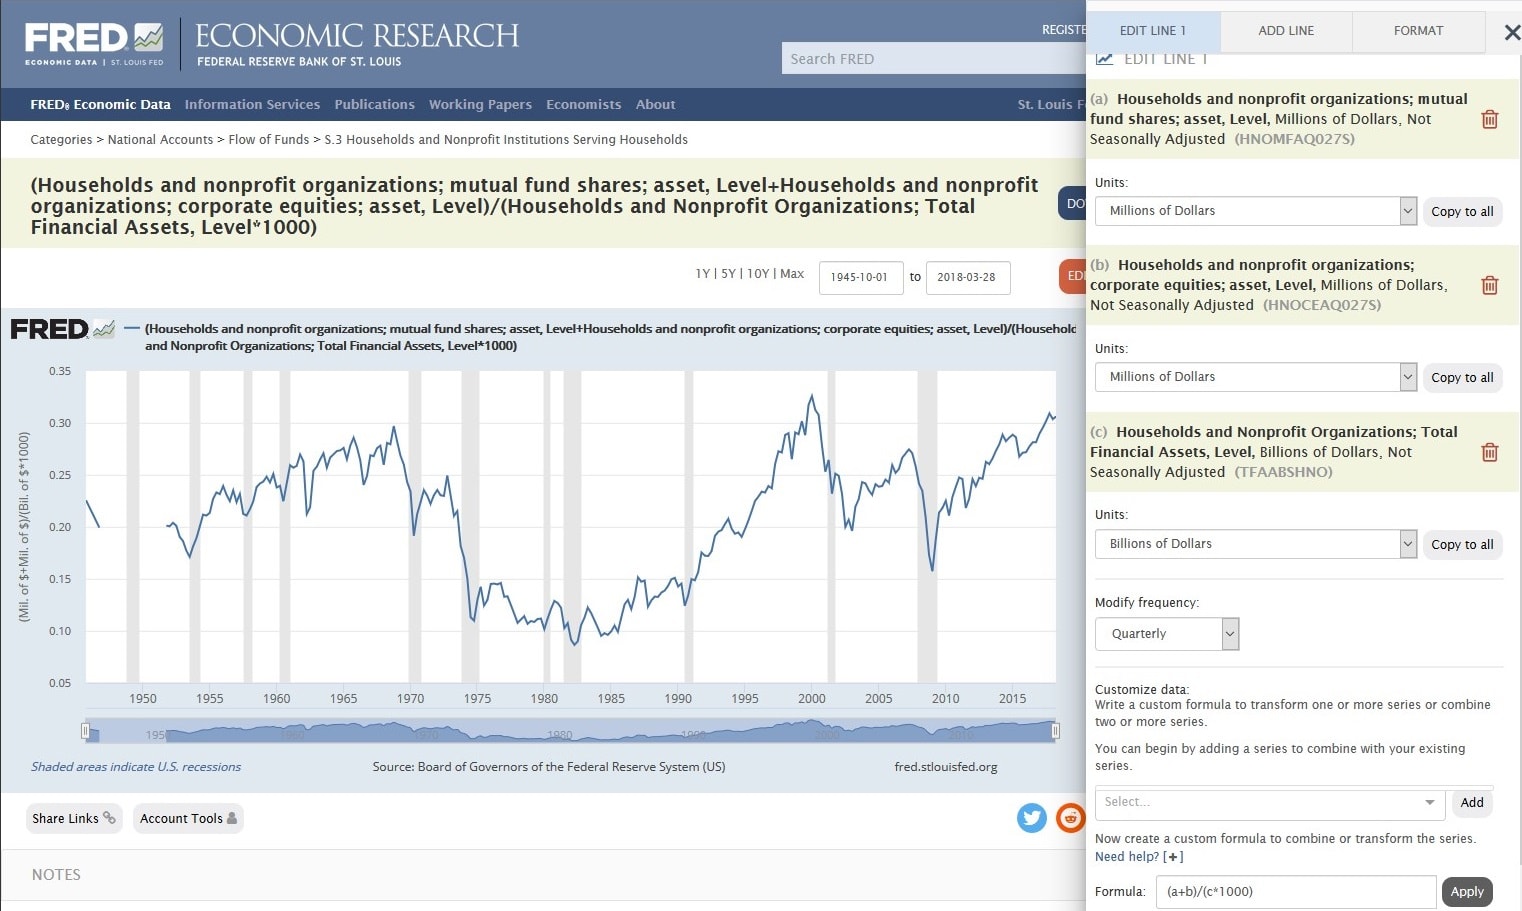
More Data can be found at the FRED. However, this data is slightly less prepared. You will have to edit the graph and calculate the respective percentage. This is relatively easy by:
- Taking Households and nonprofit organizations; mutual fund shares; asset, Level
- Add Households and nonprofit organizations; corporate equities; asset, Level)
- Divide by Households and Nonprofit Organizations; Total Financial Assets, Level times 1000
The tool is easy to use; just click edit graph, as seen in the screenshot below. For further use, you can also look at the chart below. The values differ from the ones of OECD as there is a different database. The pure numbers are to be seen in relation to previous heights.